Tydzień w gospodarce
Category: Trendy gospodarczePrzegląd wydarzeń gospodarczych ubiegłego tygodnia (30.05–03.06.2022) – źródło: dignitynews.eu

In terms of the rate of growth, Poland beat all the states of the OECD and the whole of Europe. The country is ranked 13th in the global list based on the data of the World Bank. If limited to just the members of the OECD and European countries, Poland is closely followed by Slovakia, which has a slightly lower rate of growth, four spots below there is Chile, and the Czech Republic, where the per capita income increased four and a half fold, is only ranked 36th.
Some countries which for half a century shared Poland’s role as satellite states of the Soviet Union but then much longer clung to the mirage of alternative paths towards development other than free market economy with all its pros and cons (Bulgaria), or ones that squandered the relative “achievements” of so-called Goulash Communism (Hungary), have paid a very high price for their reluctance towards reforms. They lost time, resources, and people’s energy, achieving much less than Poland. In Bulgaria, the GDP per capita increased only three-fold, and in Hungary the increase was only slightly higher (3.7 times).
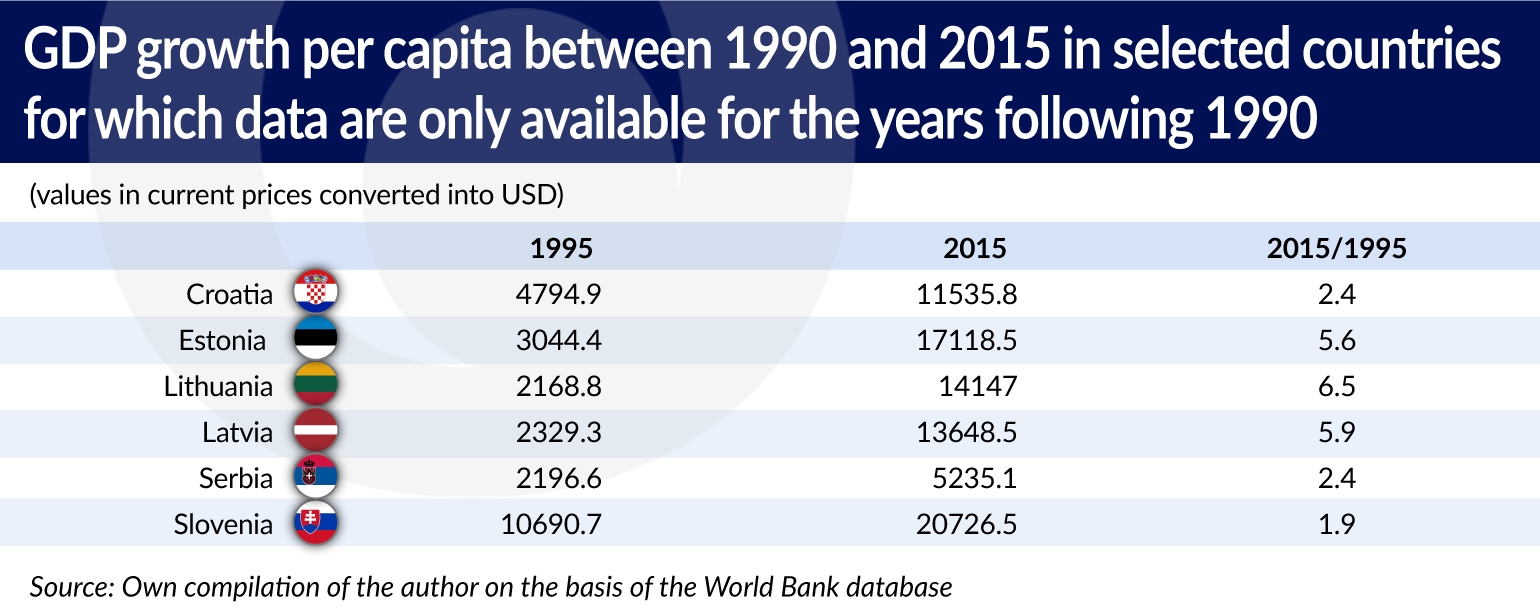
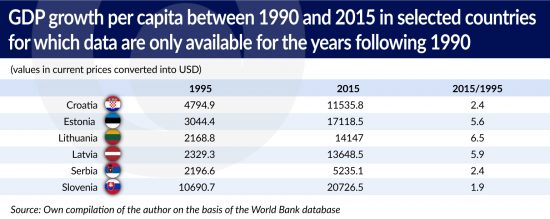
The Baltic states would most likely have matched Poland’s result or would have proven even more effective in multiplying their income, but their independent life began several years later. The World Bank only has data relating to these countries starting from 1995.
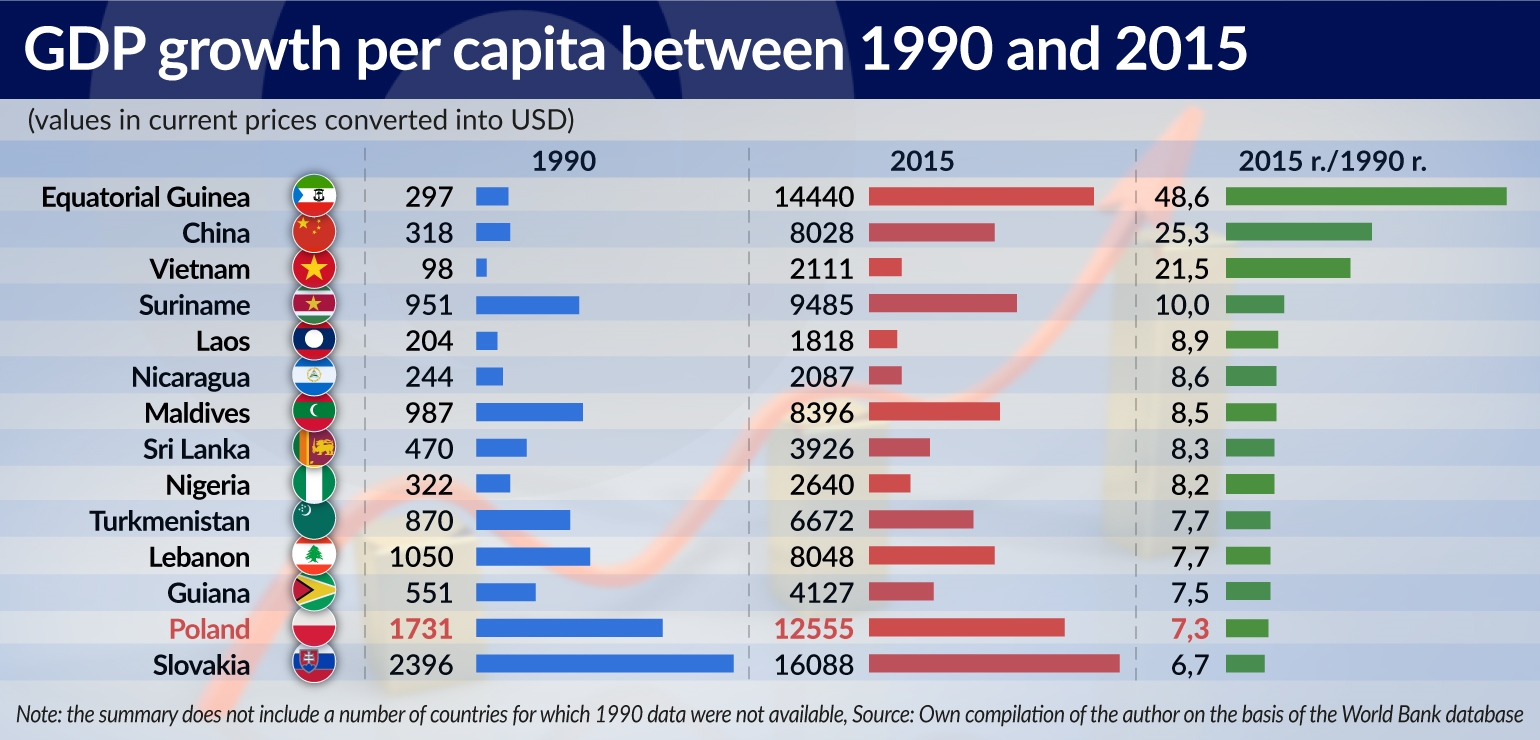
As is usually the case, such summaries contain certain distortions. The global leader in terms of income increase is Equatorial Guinea, which is a tiny, but very bloody dictatorship in the eastern corner of the Gulf of Guinea. 20 years ago oil production began in that country. In absolute terms, local oil production is not very big (1.1 billion barrels per year), but per capita this gives 900 barrels, which is about 100 barrels more per capita than in Saudi Arabia. It is not surprising therefore that the GDP per capita in that country has increased by almost 50 times, even though the profits are only going to the dictator and his clique.
With an over 25-fold increase, the real phenomenon of economic dynamism, utilization of reserves and industriousness is China – the unequivocal leader of this summary, apart from the freak Guinean result. China is closely followed by Vietnam. This country and its people are also worthy of admiration for the determination with which they are making up the time lost in wars. However, while such a conclusion could be hasty in the case of China, Vietnam would probably develop even faster if it could dump the corset of the still ruling Communist Party.
Other countries leading in the global classification confirm the rule that getting rich can (but does not have to) be quicker when you start from the bottom. In 1990, Vietnam’s GDP per capita amounted to USD98, in Laos and Nicaragua USD200, and slightly more in Nigeria – USD300, which is still very little. The examples of Equatorial Guinea and Nigeria (oil), Suriname, i.e. the former Dutch Guiana (bauxites) and Turkmenistan (gas) already confirm, however, the severity of the “raw materials curse”, in the case of which oil becomes the devil’s excrement.
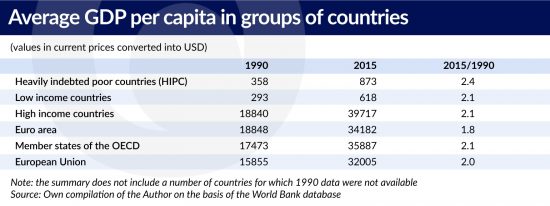
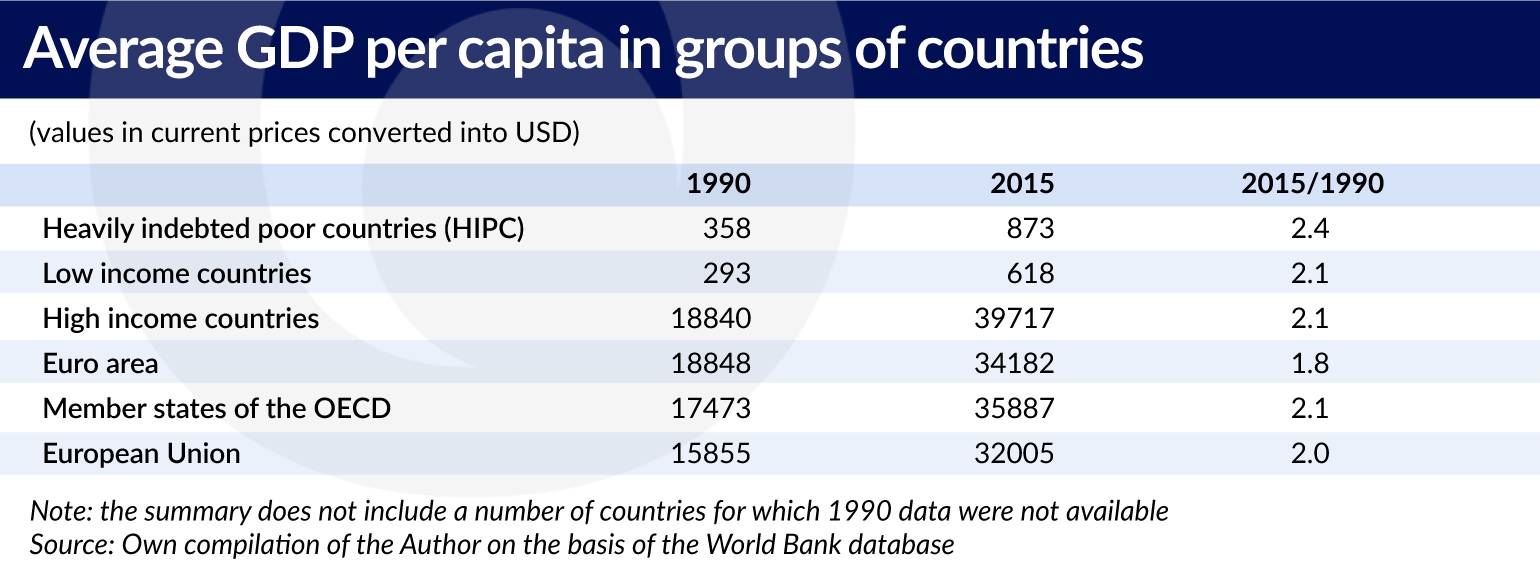
One extremely difficult burden is debt. Heavily indebted poor countries (HIPC) increased their GDP as a group by an average of only 2.4 times, from approx. USD360 in 1990 to approx. USD870 per capita currently. The level of indebtedness itself is evidence of a shortage of capital as the basis for growth, and investment funds become even scarcer as a result of the debt servicing needs.
In high-income countries, in the OECD group, in the Eurozone and in the European Union, the rate of growth was almost identical in the past 25 years, and the GDP per capita increased “only” two-fold in the years 1990-2015. The distance between low-income states and high-income states did not decrease at all, and the proportion is still 1 to 64.
In terms of growth rate, Poland has done very well so far, and in terms of absolute GDP Poland’s results place it among the rearguard of the middle-income countries.
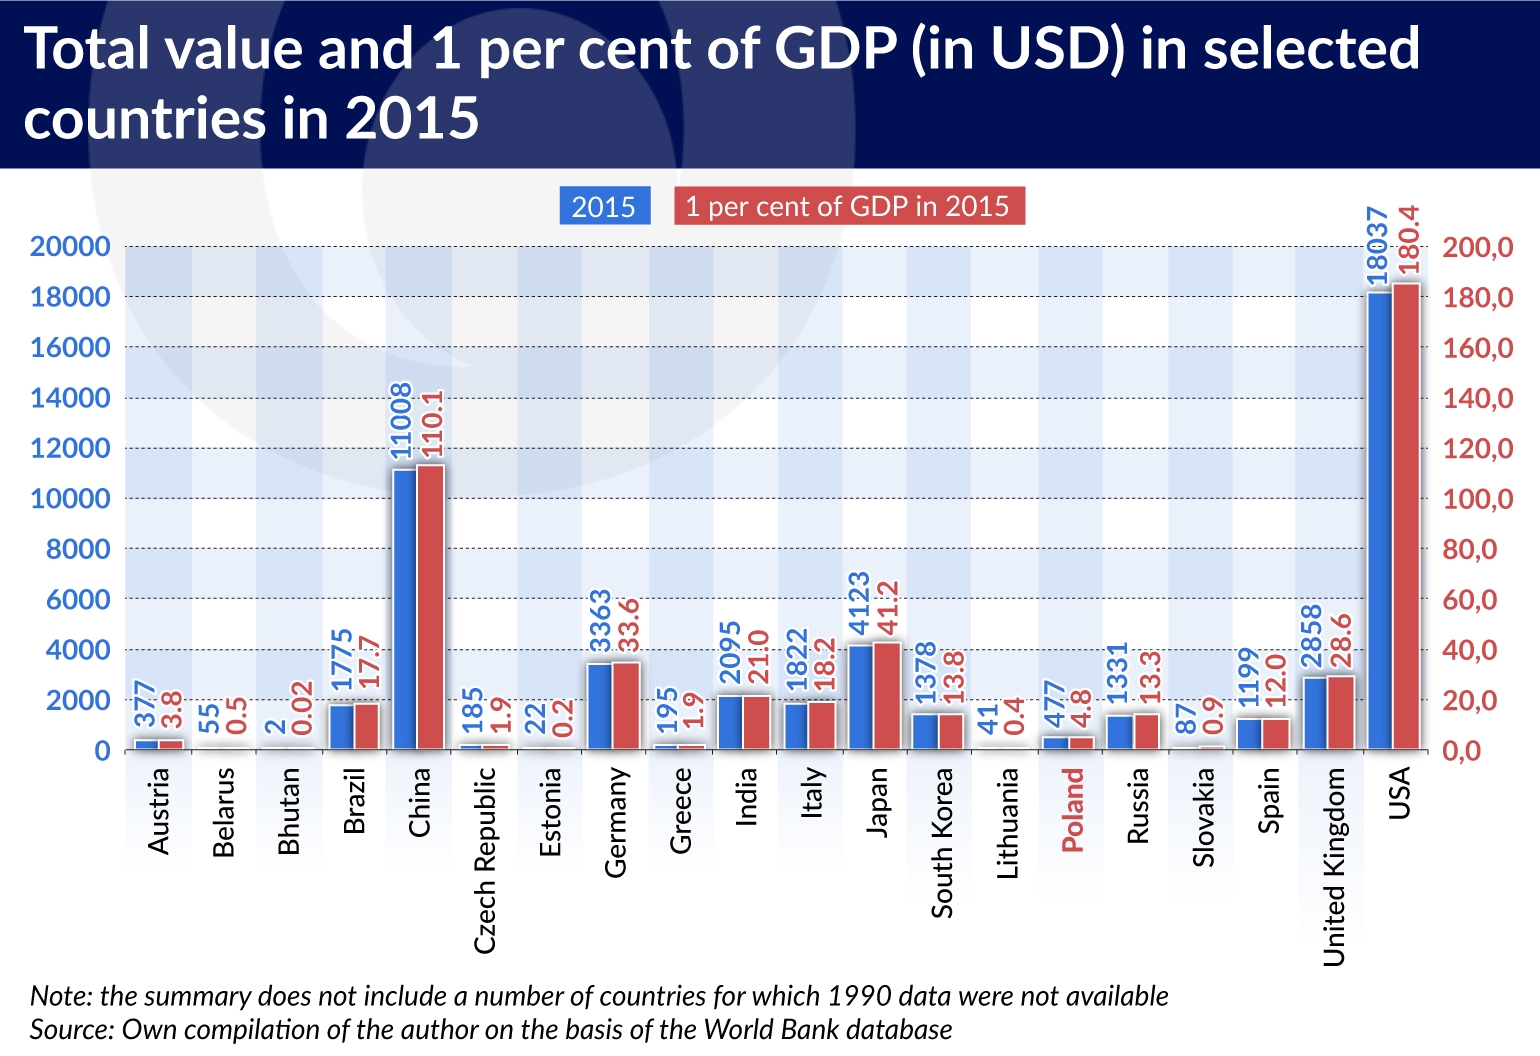
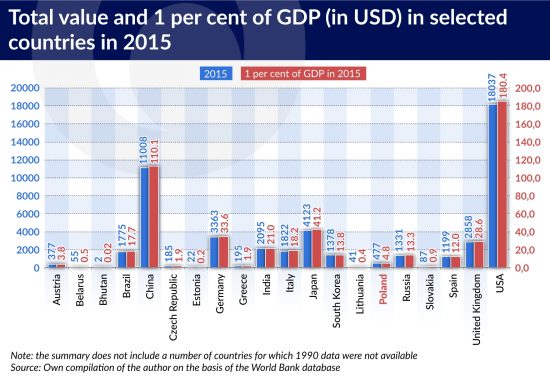
In 2015, Poland’s gross domestic product reached USD465.6bn. In 2016 it increased by 2.8 per cent, i.e. USD30bn, reaching USD478.6bn. One percentage point of annual growth currently translates to USD4.2-4.4bn.
If Poland wanted to catch up with the Germany at some point, with an average difference in the growth rate of 4 per cent against 1.5 per cent in Poland’s favor, it would take no less than half a century to make up for the difference in the GDP per capita between Poland and Germany.
Based on current prices, the per capita GDP in Germany is now three and one-third times higher than in Poland (USD41,331 compared with USD12,555). If we assume that the population and the prices in both countries remain the same, then in 2067 the average GDP per each Pole will be over USD89,000 while the average GDP per German will be USD87,000, that is two thousand dollars less.
Apart from a few billions after the decimal point, the GDP of the United States amounts to USD18 trillion. The Americans spend 17.1 per cent of that on health care (2014, World Bank), which amounts to slightly more than USD3 trillion per year. In Poland a total of 6.4 per cent of GDP is spent on health care, including both public and private spending, which translates into less than USD30bn per year.
Therefore, in the United States they spend 100 times more on health care, in absolute terms, than Poland is able to. This comparison has no common base (e.g. per capita), so it only serves to illustrate the difference in potential, based on the idea that a huge hospital with seasoned personnel will cope better with a seriously ill patient, than even a very decent small clinic.
In per capita terms, in 2014 the health care spending in Poland was USD910 per person, while in USA this expenditure reached USD9,403 and in Germany, USD5,411. Frankly, there is no point in comparing Poland to the United States, because according to the Americans themselves, as well as many international experts, the level of health care expenditure in that country is heavily inflated, not only due to greed and ruthlessness, but also due to issues of legal protection not found elsewhere in the world, as well as the effects of the rapid implementation of all successful new treatment methods, machines and entire technologies.
Without going into much detail, it could be safely assumed that for the purpose of such comparisons with Europe, the US per capita expenditure should be reduced by half. Consequently a much better point of reference for Poland would be Germany.
In absolute terms, the health care spending in Poland increased in the period 1995-2014 four and a half fold, i.e. from USD197 to USD910 per capita. This is a nominal increase, including the effects of price growth, so the actual increase was much, much smaller. In order to confront these figures with personal perceptions, we can refer to the “inflation calculator” activated on the website of the Polish Ministry of Finance. There is a certain problem, as this device calculates the change in the PLN, while the World Bank converted the PLN into USD, but we can overlook this issue, since we are not taking an exam and this analysis is done for illustration purposes only.
According to the indications of the inflation calculator, USD910 in 2014 (spent in Poland) would have the value equivalent to USD321 in 1995, which means that the real growth in expenditure over 20 years was barely 63 per cent. The perception of many Poles that too little has changed for the better in health care seems to be correct.
In Germany the nominal increase in spending on health care was similar to the real increase in Poland, and amounted to a very modest 73 per cent in the same period of 1995-2014. However, this should not serve as any sort of consolation for Poland, because in 1995 per capita health care expenditure of Poland’s western neighbor was almost 16 times higher. In other words, 20 years ago the Germans were already enjoying good health care, so their progress in this field should be slower.
Germany spends 1 percentage point less than Poland on health care, as its share of such expenditure in GDP amounts to 5.4 per cent. The current Polish newborns would have to wait until the end of the 21st century, that is, until they are about 80 years old, before the per capita health care spending in these two countries reaches the same level. Of course under the condition that we:
The share of private consumption in the GDP, i.e. everything that we spend on ourselves and on our loved ones, amounts to approx. 60 per cent. One percentage point of GDP more or less is approx. USD2.6bn more or less to be spent by Poles during one year. On the scale of a relatively large and populous country, this is not a huge sum, as it amounts to only USD70.2 per person per year, but it’s really worth fighting for.
Creating the conditions for the development of the country and society, and along with it also the development of the economy, is one of the most important activity. Poland should continue its efforts and keep fighting for every percentage point of economic growth. Other nations, such as the Germans, the Dutch, the French, the Japanese, and the Americans, can rest on their laurels.