Tydzień w gospodarce
Category: Trendy gospodarczePrzegląd wydarzeń gospodarczych ubiegłego tygodnia (30.05–03.06.2022) – źródło: dignitynews.eu

Health care and pensions are the biggest expenditures in Polish government (BY-NC-ND-TK-Presse)
States have always tended to expand and people to criticize it. In 1888, a French economist, Pierre Paul Leroy-Beaulieu, calculated that a state should have a share of 12-13% of GDP – just above the average at that time. By 1960, sprawling welfare states of Europe had pushed the average to 28%. That feat sufficed to convince Hayek and the like to claim that it is enough to limit the spontaneity and independence of entrepreneurs. Yet, the following years saw another surge of the state, pushed mainly by ever-growing transfer payments aimed at the poor and a number of other benefits for the middle class.
After the 2008-2012 cuts, it seems that a new approach has emerged: if the debt is on the rise, then the state revenue is too low and the economy needs assistance. We need to print enough money to accelerate its growth, which will bring a return in the form of increased taxes. Jacek Rostowski, a liberal, recently spoke highly of the Keynesian theory – something that would have been unheard of before. Today, it is very high on agenda because of the upcoming budget review. According to the IMF projections, our spending will decline from the current levels. However, this forecast may need an adjustment.

The state provides mostly public goods and that is what it spends money on. Public goods are goods which the state can deliver more efficiently than the private sector and which satisfy the needs of the general public. The basic characteristic of public goods is that they cannot be excluded from consumption and are non-competitive at the same time. A classic example of a public good is national defence. The role of provider of public goods may be more or less complex, depending on what we perceive to constitute public goods – e.g. in Poland, health care is considered a public good, but in the US it is a private good.
From the perspective of the social policy, the most important role of the state is the redistributive role, i.e. changing the income structure so as to protect the economically-weaker groups and thus combat poverty. This role is implemented in the form of taxation policy, transfer payments aimed at households and a system of social benefits provided to households free of charge or below the market prices. Spending under this category consumes the biggest share of our budget.
Public spending includes all funds aimed at the implementation of central and local government undertakings. The UN, OECD and the European Commission have developed a uniform category of public spending, which also applies to Poland. COFOG (Classification of the Functions of Government) is a common methodology, agreed upon by the Ministers of Finance, for classifying budgetary expenditure into 10 divisions, each of which is broken down to groups and finally to classes. This classification is very detailed and enables a statistical and dynamic comparison of even the most minute elements of state budgets.
When the government strategies were drafted in the years 2010-2012, an attempt was made to transpose the universal COFOG language into the Polish task-based budget, but it proved to be in vain. None of the Polish ministries managed to adjust the simple and logical COFOG divisions to their expenditure and investments stemming from the task-based budget – even though the premise was that it would be based on this classification.
The analysis of public spending on the basis of COFOG is beneficial because particular elements of this classification are a result of international arrangements and consultations with the European Commission. It means that national statistical offices provide data which are comparable.
Furthermore, COFOG classification is functional, not institutional, with expenditure not being connected with budget administrators, which makes it possible to compare measures taken under different public policies. For this reason – even though its transposition into the activities of Polish authorities failed – COFOG is a useful analytical tool.
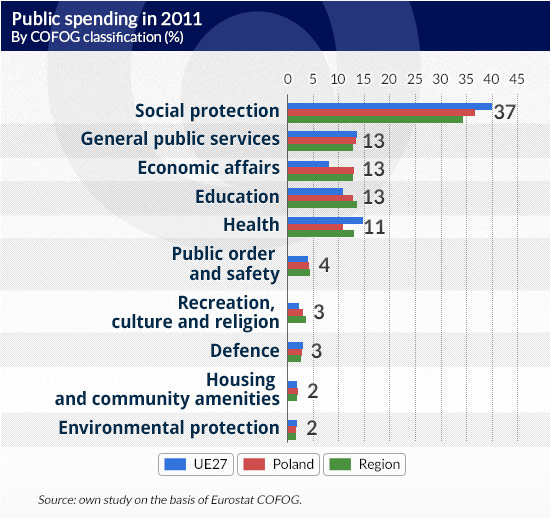
In 2011 public spending constituted 43.4 % of Poland’s GDP, while the EU average amounted to 49.1 % and the average for the countries of the region (Poland, Czech Republic, Slovakia, Hungary, Slovenia, Lithuania, Latvia and Estonia) was 42.2 %. The differences between Poland and the rest of Europe were also visible in terms of spending structure.

The biggest divergence was observed in the Economic affairs category. It includes mostly investment expenditure, grants, co-financing and subsidies, but also patent and consumer protection and labour market policy.

The main driver of emerging differences between the Poland and EU average are road infrastructure investments – Transport group (dark red in the chart) has constituted the largest part of economic spending ever since Poland joined the EU.
On the other hand, support for enterprises has a rather low priority. In 2011, expenditure under General economic affairs group (which includes measures) constituted merely 0.7% of the total public spending (EU average is 1.8 %, and regional average is 2 %).
Although agriculture in Poland saw considerably less public spending than in the years 2007-2008, this amount is still above the EU and regional average. It resulted mainly from the fact that a previous financial perspective was coming to an end and Polish agriculture received robust financial support from the EU funds.
Social protection is the largest spending category in almost all EU states. Although this type of spending in Poland is below the EU average, which may be satisfactory for the opponents of a welfare state, a closer analysis of individual expenditure is not very optimistic.

For years our spending on old-age pensions has been above the EU and regional average. The alarming aspect is that our ageing society is still younger than the societies in majority of the “old” European states. In 2011, old-age pensions consumed 21.7 % of total public spending. The respective share in Germany’s budget was 21.2 %, in Sweden 20.5 % and in the United Kingdom – 17.7 %. Bulgaria, Greece, France, Italy, Austria and Portugal spent more than Poland.
Moreover, only Germany, Italy and Malta spent a bigger part of the public funds on survivor benefits and pension inheritance. In 2011, Poland spent 3.7 % for this purpose, while the EU average was 2.1 % and the regional average 1.8 %.
We take care of seniors at the expense of younger generations – it is clearly visible if we compare expenditure in this regard with the spending on support for families (2.8 % in 2011, while 4.2 % was the average in the EU and 3.8 % in the region), support for the unemployed (1.4 %, 2.5 % in the EU and 1.5 % in the region) or on counteracting social exclusion (0.7 %, 1.5 % in the EU and 1.3 % in the region).

The proportion of spending on treatment in outpatient clinics and hospitals does not really differ when compared with the EU average. However, our public expenditure on drugs and medical equipment is the smallest among all the EU states – merely 0.2 %. In comparison, Czech spending on this purpose amounts to 2.6 %, Hungarian – 3 %, Portuguese – 2.8 % and Bulgarian – 2 %. Low expenditure on drug reimbursement translates into a burden for patients – private spending constitutes currently approximately 60 % of total spending on drugs.
Relatively high amounts are spent on higher education institutions – in 2011 they constituted 3.7 %, as compared to 2.1 % spent on average in the EU. The results are evident – the share of Poles in tertiary education is among the highest in Europe; the question remains whether it is necessary. In Germany and France, where higher education is usually free of charge, public spending on this sector is 2 % and 1.4 % of the budget, respectively. In the United Kingdom, public expenditure on this purpose also amounts to 1.4 % of the total budget.
Spending on pre-school and primary education, even though it constantly decreases, remains proportionally higher than the EU and regional average. In 2011, it amounted to 4.1 %, as compared to 3.6 % and 3.7 %, respectively. We must keep on developing
Judiciary system is relatively expensive – in the years 2004-2011 it consumed 1.4 % of the public spending on average. The EU average was at this time only half as high and the regional average was 30 % lower.
We also spend more than other EU countries on housing development – in 2011 our expenditure in this category constituted 1.2 % of the budget, while the EU average was 0.5 %. Only Bulgaria spent more on housing, i.e. 1.7 % of its budget. Poland continues to support and develop public housing and Social Housing Associations.
Although the opposite might seem more plausible, we do spend relatively high amounts on culture – in the years 2004—2011 the average was approximately 1.8 %, each year above the EU average of almost 1.2 %. It must be said, therefore, that our state is a generous patron, although it might also indicate that the private cultural patronage is deficient. It should also be noted that this category includes subsidies for the biggest group of Polish museum objects i.e. churches.
What can the government do
One sector which will certainly be subject to cuts this year is the army – Poland’s spending on this sector is comparable with other European countries, but they probably spend more on the military R&D. Military innovation are often used commercially, as proven by the most notable example i.e. the Internet.
The allocation for defence in the budget for 2012 was PLN 29.2 billion, out of which PLN 27.8 billion were actually used. It was the result of cuts in military spending on R&D and remuneration for officers. The Polish army is not to be compared with the US army, but a better prioritization in this area and reduction of the administrative burden would have a positive impact on the economy.
According to current forecasts, eight out of eighteen ministries will introduce savings exceeding PLN 4.5 billion in total. The ministries of defence, agriculture and science are the leaders of cuts, while the Ministry of Administration will introduce the most modest savings.
The Minister of Science and Higher Education has promised to save a total of PLN 287 million. The National Science Centre will repay PLN 15 million and the National Centre for Research and Development — PLN 70 million to the Ministry. Last year, these amounts were more significant – PLN 70 million. The Ministry will save PLN 22 million on international cooperation programmes and PLN 17 million on the construction of the Facility for Antiproton and Ion Research in Europe.
One could say that similar savings are going to be introduced this year concerning those types of expenditure which Jerzy Hausner and Witold Orłowski list in their latest reports as the most development-oriented and necessary for increasing the innovation of the economy.
It is rather unlikely that that we will see reforms in expenditure with an overdeveloped structure in Poland when compared to other countries. We have a relatively younger society and yet we spend more than others on old-age pensions. In 2012, the biggest savings were made on the expenditure on social security for persons on child-care and maternity leaves. The Minister of Labour promised that this year there would be no cuts in old-age and disability pensions, unemployment benefits and social assistance.
The situation of the Social Insurance Institution will not improve until all reforms come into force, i.e. until the retirement age is fully extended.
However, no attempts have been made to make savings on branch-specific schemes, on Agricultural Social Insurance Fund (KRUS) or on health care system which is underfinanced due to misguided spending.
Next in line for adjustments should be the limitation of survivor benefits and the inheritance of family benefits, which are not related to defined contribution schemes.
It seems that the growth of the public spending takes place in those areas which are not particularly conducive to economic growth. They can only increase the purchasing power of the society, i.e. increase the demand on the domestic market (pensions and benefits), which obviously stimulates the growth of GDP.
At the same time, growing expenditure increases fiscal burden, which in turn drives the purchasing power down and can put the economy to a halt. It is a vicious circle which is not sustainable in a long-term perspective due to the insufficient labour force.
Defining priorities for public spending is a difficult task, but this year it is even more difficult than before. Although being pressed against the wall makes it easier to make difficult decisions, we are more likely to see more of accounting adjustments. If only we could learn from the countries in our region and adjust our spending structures to theirs.