
(GotCredit, CC BY)
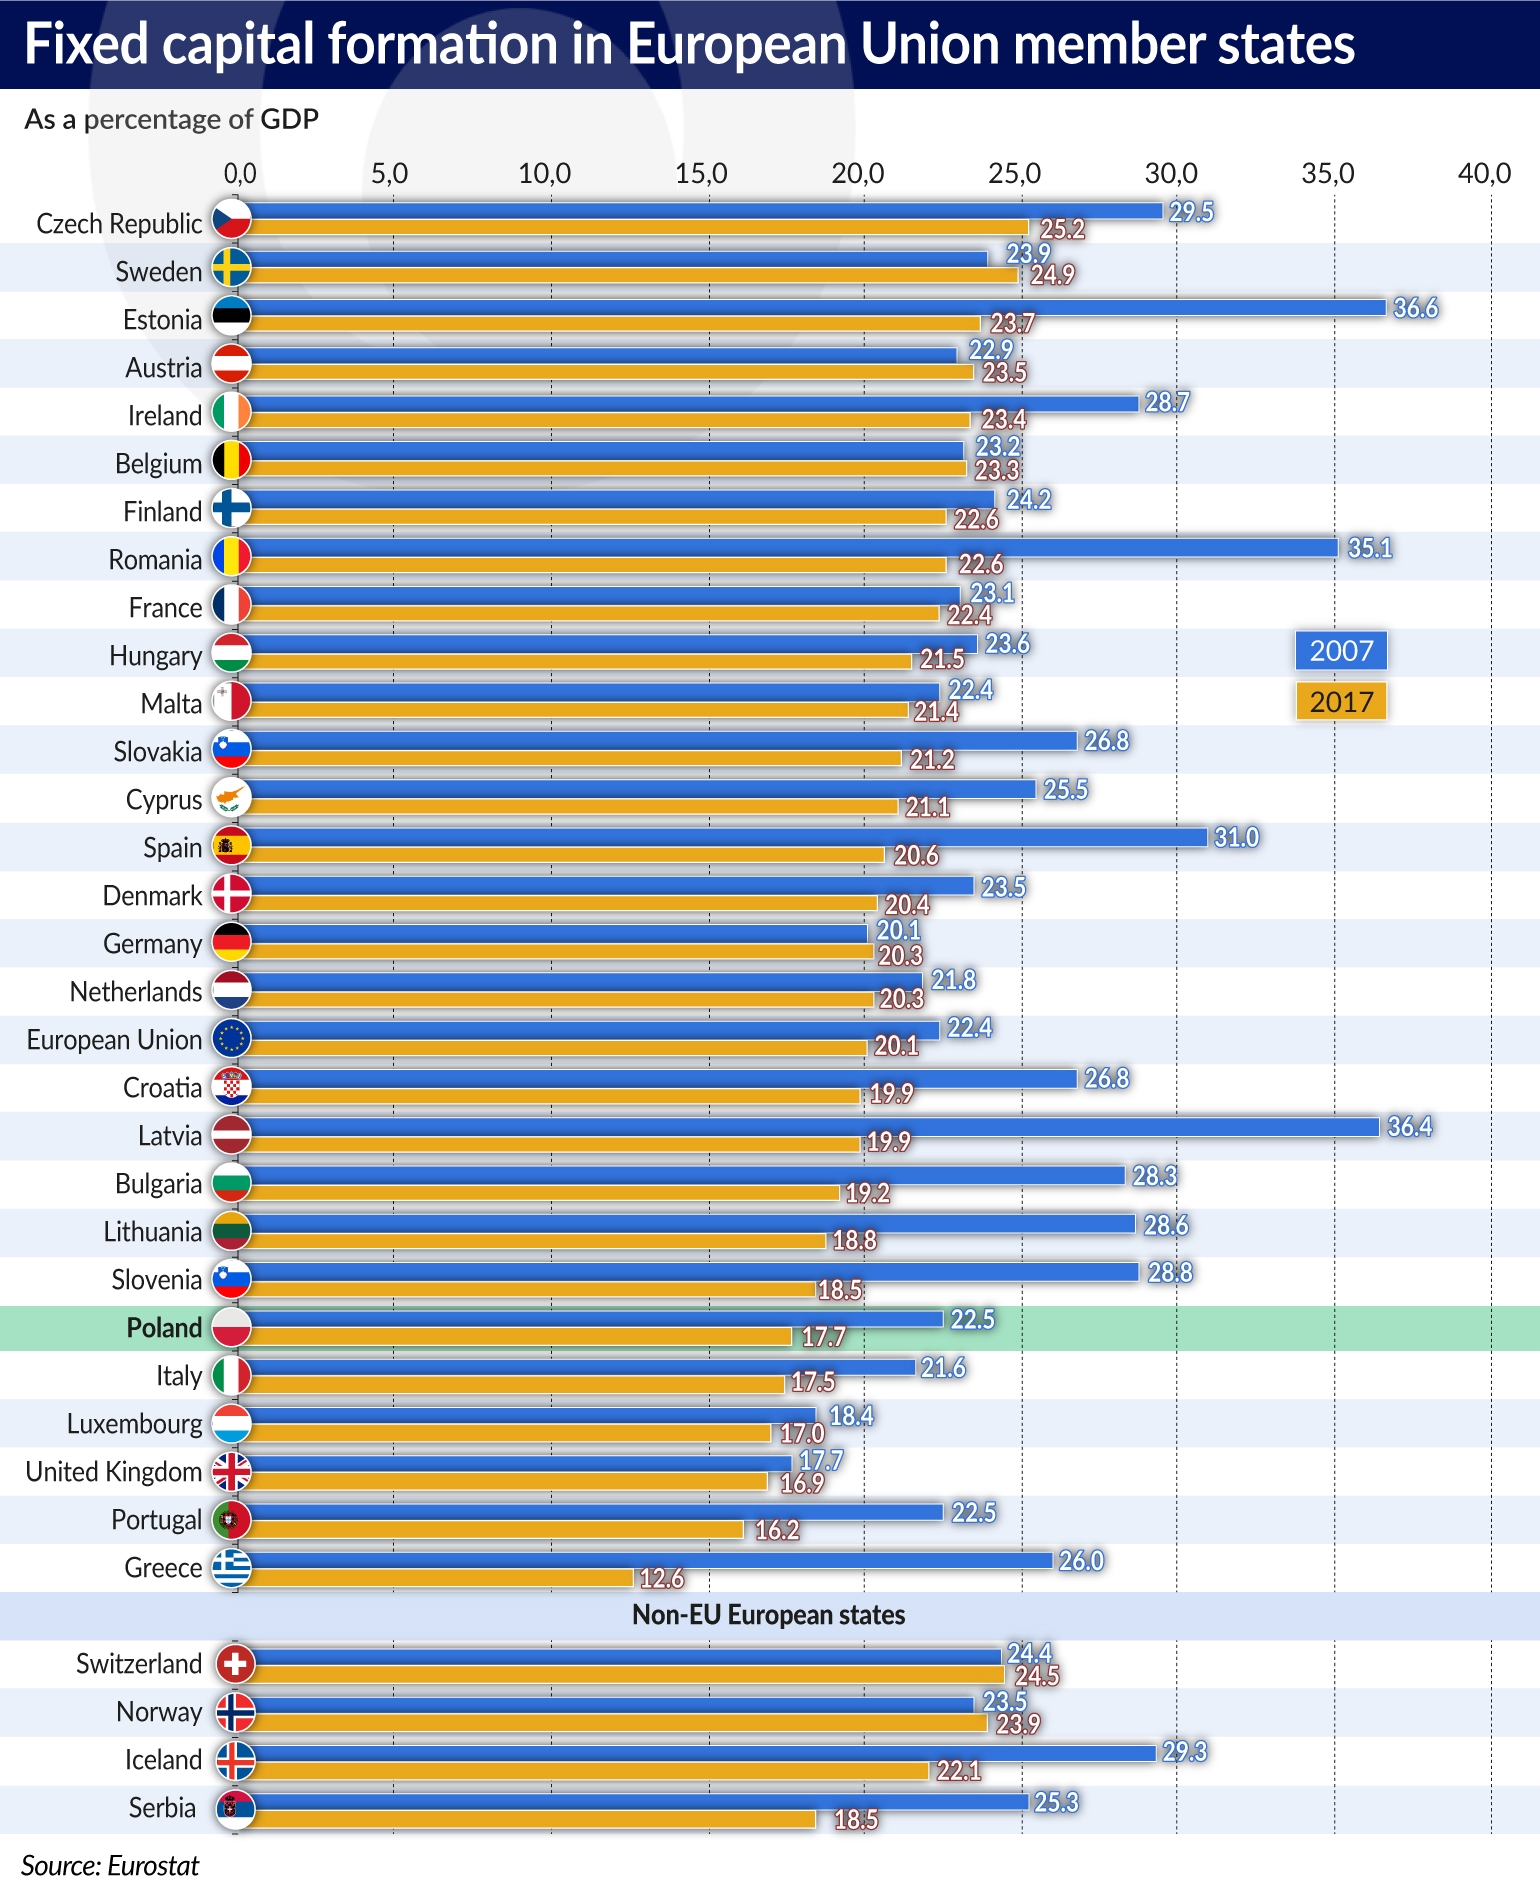
According to data collected by Eurostat, in 2017 fixed capital formation, that is, expenditure increasing the value of assets, including increasing the value of intangible and legal assets, increased significantly in relation to the previous year only in Cyprus (by about 3.7 per cent of the GDP), Latvia (1.7 per cent) and in Estonia (1.4 per cent). However, for Cyprus, Latvia and Estonia, this was not so much an increase as a return to the previously recorded levels.
Czech Republic in the lead, while Poland disappoints
Last year, among the EU member states the highest fixed capital formation to GDP was recorded in the Czech Republic (25.2 per cent), which only slightly exceeded Sweden (24.9 per cent of GDP), Estonia (23.7 per cent), Austria (23.5 per cent), Ireland (23.4 per cent) and Belgium (23.3 per cent). Among the non-EU states, high fixed capital formation was also recorded in Switzerland (24.5 per cent) and in Norway (23.9 per cent). Poland’s result (17.7 per cent of GDP) is far below the EU average. It provides little consolation that even worse results were recorded by Italy or the United Kingdom, not to mention Greece, which is coming out of a recession with considerable difficulty.
More long-term comparisons provide a better picture of the investment levels and the future economic climate. Taking into account the results of the last 10 years, it could be said that in terms of the economic development of the EU, this was a wasted decade. In the past year only four EU countries recorded a higher share of investment in GDP than in 2007: Sweden, Austria, Germany and Belgium. Among non-EU countries, Norway and Switzerland also achieved such a result. All other countries recorded a decline. The sharpest drop occurred in Latvia, but in that country — despite a decrease by 16.5 percentage points — the share of investment in GDP is still higher than in Poland. In 2017, the share of investment in GDP in Poland was the lowest not only in the last 10, but even the last 20 years.
Half of all expenditure goes to construction
Eurostat enable us to take a closer look at the structure of investment in the individual countries. Approximately half (exactly 49.5 per cent in 2017) of fixed capital formation in the EU is related to construction investments. Their share decreased by 5 percentage points in the last 10 years. In Poland, the share of construction investments is slightly higher — in 2017 it amounted to 50.9 per cent, compared with 52.6 per cent in 2007. In the past year, among the EU member states construction accounted for the highest share of investment in Finland (57.4 per cent of expenditure) and the United Kingdom (57.1 per cent), but the highest level in Europe overall was recorded in Norway (69.6 per cent), which may have something to do with the climate in this rather chilly country. The lowest share of construction investment was recorded in Ireland.
Expenditure on machinery and equipment in the EU member states amounted to approximately one-third (30.9 per cent) of the total fixed capital formation. Poland looks good in comparison (the share of this expenditure in Poland reached 41 per cent in 2017), but Slovenia and the Czech Republic recorded even better results, and the highest share of expenditure on machinery was recorded in Greece, which is probably a statistical effect resulting from the general investment slowdown in that country, which especially relates to construction. In 2017, the share of expenditure on means of transport reached 9 per cent on average in the EU, and Poland’s result wasn’t far from that average (9.8 per cent).
Ideas build the future
Future prospects may be determined by today’s investments, not necessarily those related to new buildings and machines, but primarily those associated with the protection of intellectual property, including, among others, investment in patents or licenses. According to the Eurostat documents, in this case the European Union countries are clearly investing more than 10 years ago. In the years 2007-2017 expenditure in this field in the EU countries (the picture is incomplete, as not all the countries have provided the relevant information) increased by over 30 per cent, from nearly EUR430bn to almost EUR597bn. Their share in total investment increased on average from 14.7 to 19.4 per cent.
During this time Poland noted a similar percentage increase (by 29.5 per cent), but in absolute terms these were much smaller amounts (an increase in outlays from EUR4.3bn to EUR6.5bn). The share of expenditure on the protection of intellectual property in the total fixed capital formation increased from 6.1 to 8.5 per cent and still remains far below the EU average.
Expenditure in this area serves as confirmation of a good climate for the creation and implementation of modern solutions. That is why our economy should certainly attempt to emulate countries such as the Netherlands (where the share of such expenditure reaches 23.3 per cent), Sweden (25.5 per cent), and Denmark (25.9 per cent), not to mention Ireland, whose achievements in this regard are unparalleled in Europe (41.7 per cent). Ireland increased expenditure on the protection of intellectual property from EUR7.1bn in 2007 to nearly EUR29bn in 2017. This is an increase of 230 per cent. A slightly lower scale of growth in this area was recorded in Estonia, but in absolute terms the level of expenditure in that country is much lower (an increase from EUR238m to EUR518m).
Eurostat report on investment in the EU can be found here.